Examples
Interactive Jupyter notebooks in static/ walk through classification, regression, and hyperparameter exploration. Each notebook trains SnapBoost and compares it against XGBoost and LightGBM on the same splits.
Notebook |
Dataset |
SnapBoost |
XGBoost |
LightGBM |
|---|---|---|---|---|
Breast Cancer Wisconsin |
97.2% accuracy |
95.8% |
96.5% |
|
Diabetes |
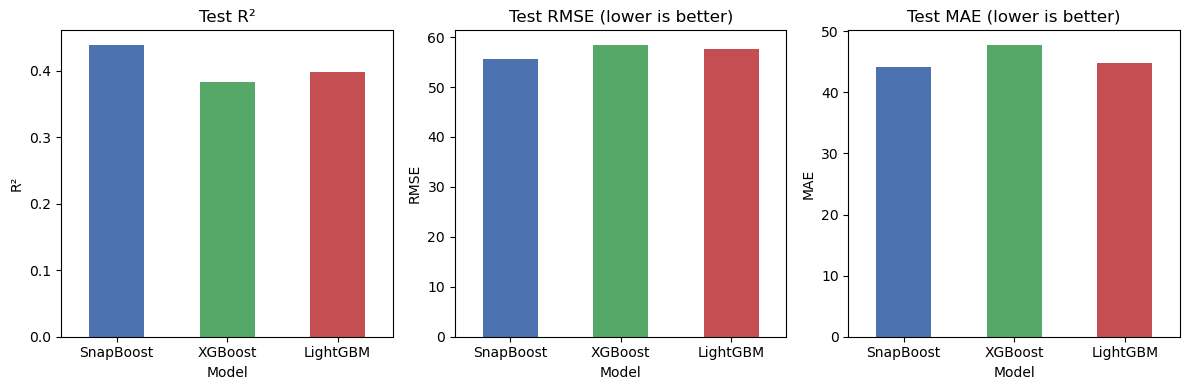
R² 0.44, RMSE 55.7 |
R² 0.38, RMSE 58.4 |
R² 0.40, RMSE 57.7 |
|
Synthetic (piecewise + smooth) |
R² 0.986, RMSE 0.170 |
R² 0.986, RMSE 0.174 |
R² 0.987, RMSE 0.167 |
Run the notebooks locally:
pip install -r requirements.txt xgboost lightgbm
jupyter notebook static/
Classification
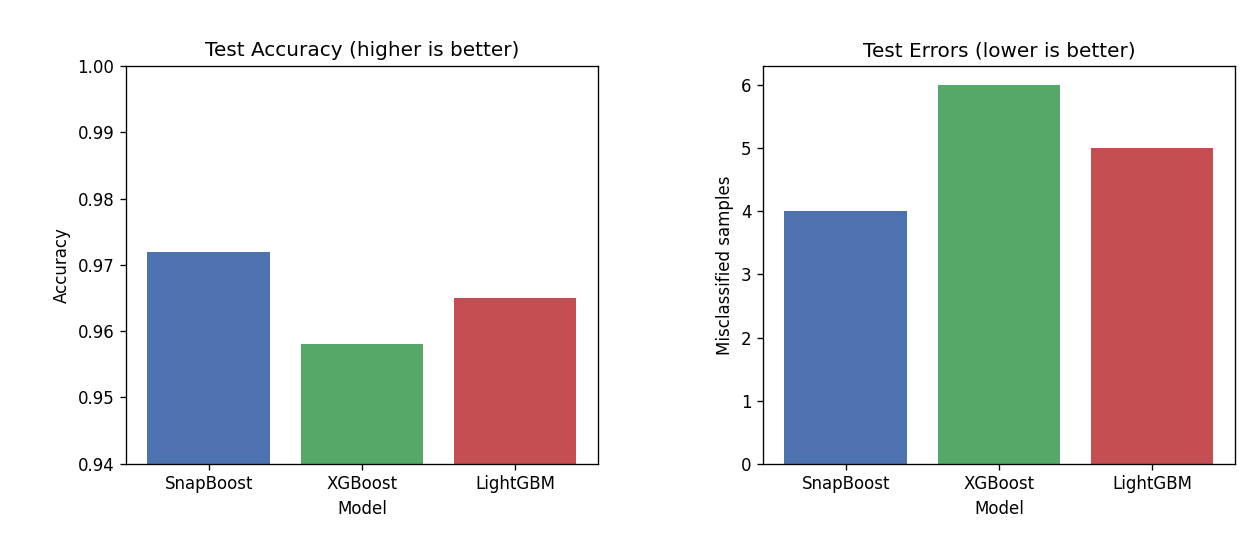
On the Breast Cancer dataset (250 boosting rounds), SnapBoost achieves the highest test accuracy and fewest misclassifications among the three boosters.
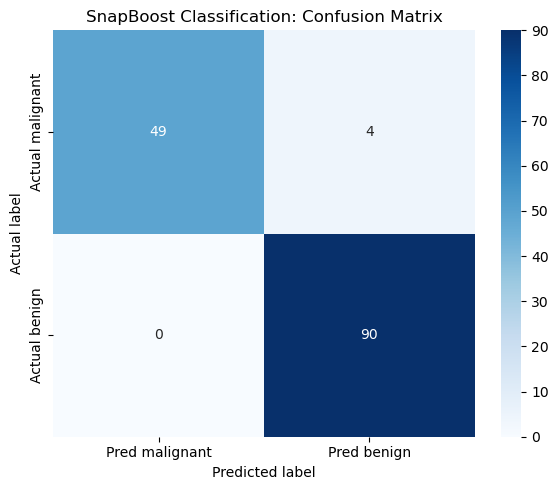
Confusion matrix for SnapBoost on the held-out test set:
Regression
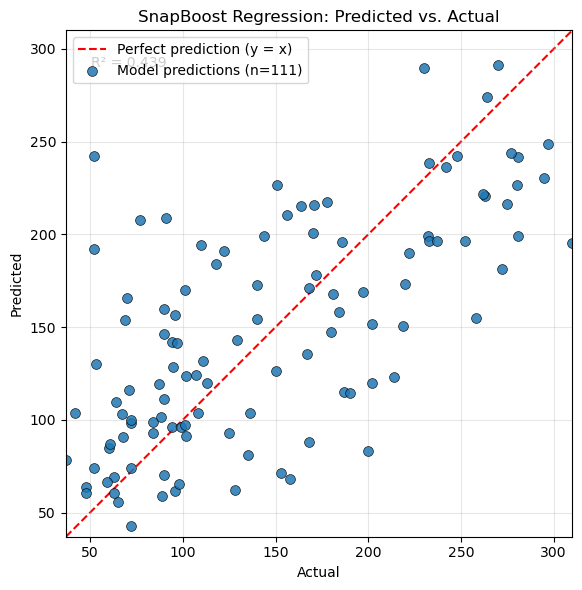
On the Diabetes dataset (100 boosting rounds), SnapBoost improves R² and RMSE over tree-only baselines.
Predicted vs. actual disease progression:
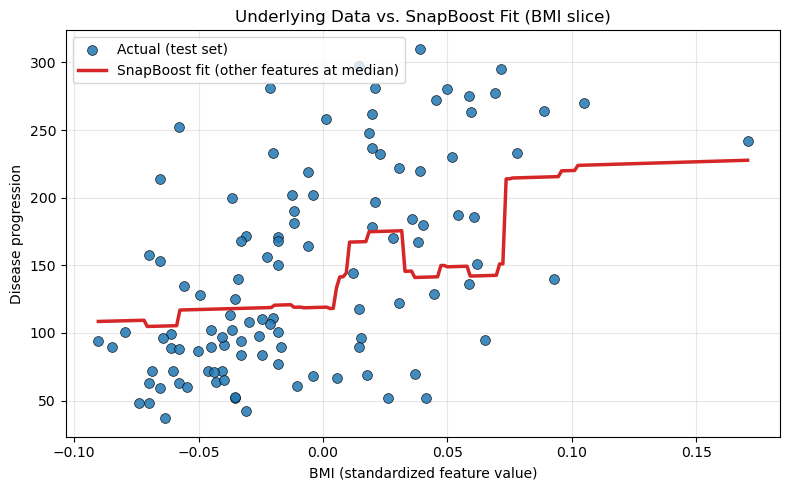
SnapBoost fitted curve along BMI (other features held at training medians):
Parameter exploration
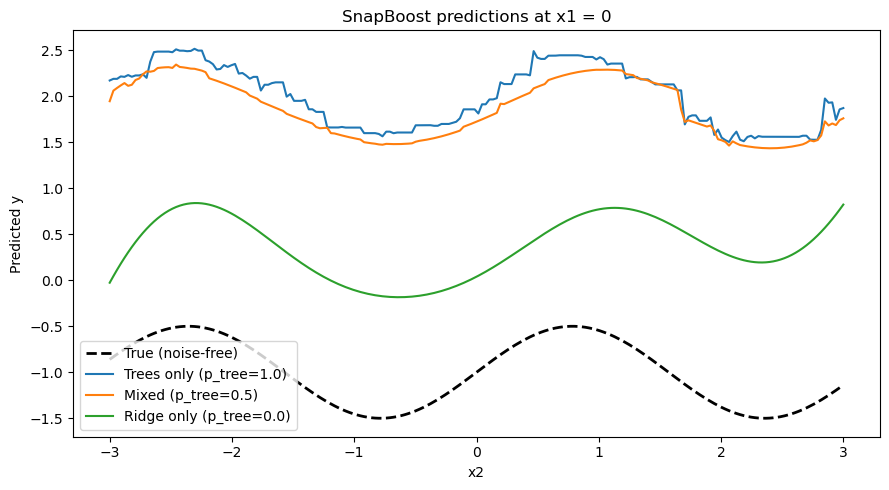
On a synthetic dataset mixing piecewise-linear and sinusoidal structure, a mixed ensemble (p_tree=0.8) outperforms trees-only (p_tree=1.0, RMSE 0.174) and ridge-only (p_tree=0.0, RMSE 0.366):